The problem
Energy analytics depends on data that arrives from many systems with different shapes, update patterns, and reliability profiles. Without a clean pipeline layer, model development and dashboard work both slow down.
What I built
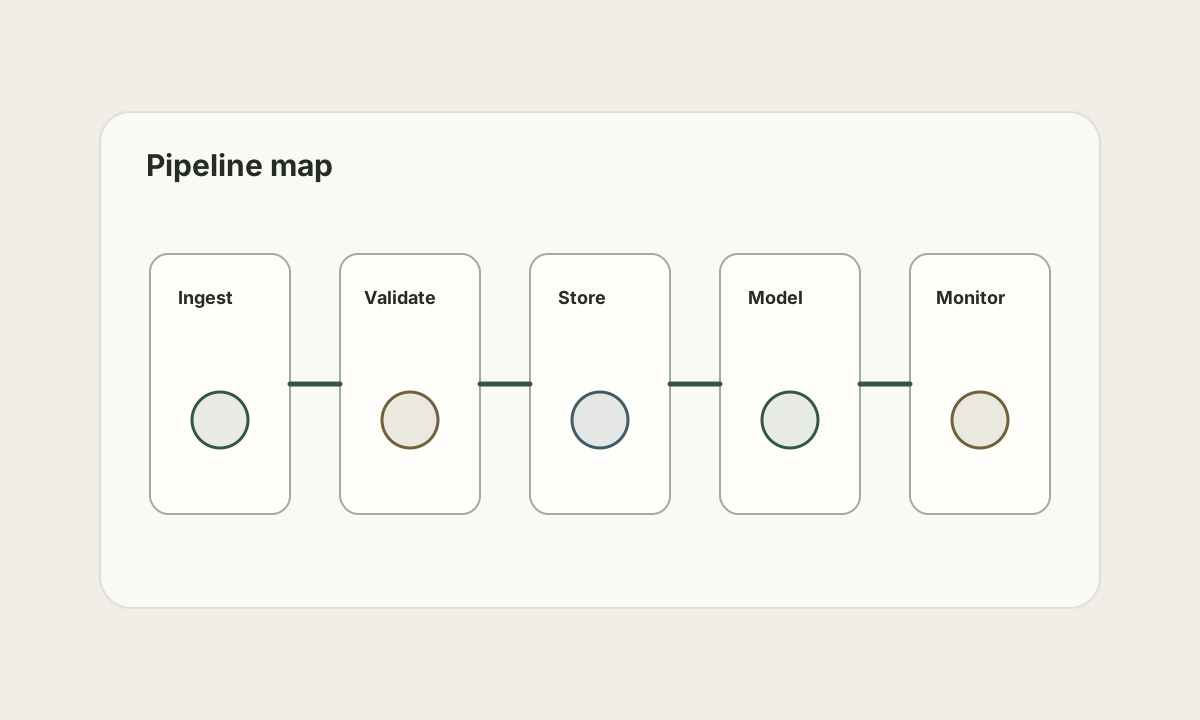
I engineered scalable data pipelines that integrated Snowflake, Pi Vision, Canary APIs, and analytics workflows for renewable energy clients. The goal was to make high-volume sensor streams usable for performance tracking, model inputs, and real-time KPI monitoring.
- Integrated diverse operational data sources into analytics-ready pipelines.
- Handled millions of sensor readings daily for asset performance workflows.
- Created dashboard-ready datasets for real-time KPI monitoring.
- Supported model deployment and alerting by making upstream data more reliable.
- Worked across data engineering and data science boundaries so analysis could move faster.
Millions
of sensor readings handled daily
4
major energy domains supported: BESS, Solar, Wind, Oil & Gas
Technical shape
The core engineering challenge was turning industrial data feeds into repeatable analytics inputs. That meant normalizing identifiers, making freshness visible, and shaping data so downstream models and dashboards did not have to rediscover the same source quirks.
select
  asset_id,
  timestamp_utc,
  measurement_name,
  measurement_value
from sensor_readings
where timestamp_utc >= dateadd(day, -7, current_timestamp);
What changed
The pipeline layer became a foundation for faster analytics, model delivery, and operational visibility. With cleaner data contracts, the team could build predictive models and dashboards without repeatedly rebuilding ingestion logic.